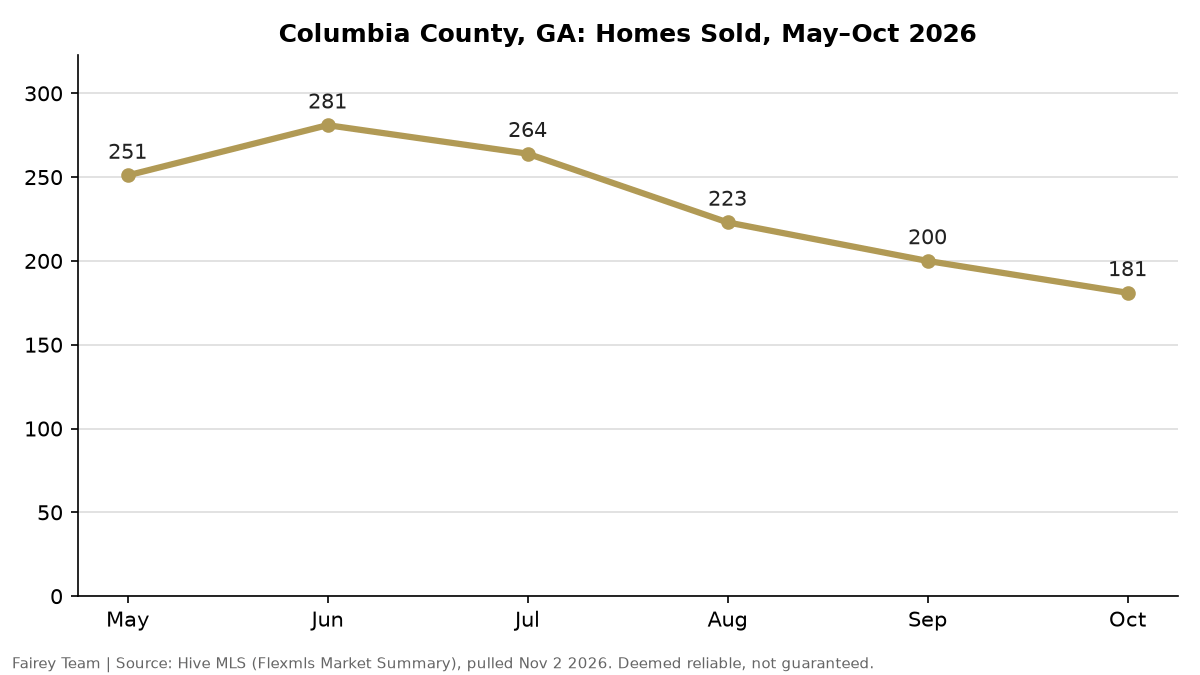
Columbia County is leaning toward buyers, but homes priced right are still selling in about six weeks. In October 2026, 181 homes sold at a median price of $334,000, up 6.1% from last October, with 840 active listings in October. The median sale took 44 days, while the typical home still for sale had been listed 88 days.
That’s the short answer. Here’s what it means for your next move in Evans and Columbia County.
You want to make a smart move. Buy at the right price. Sell for what your home is worth. But the headlines are noisy, and the numbers are confusing. Make the wrong call, and you either overpay or watch your listing sit while the price cuts pile up.
You don’t need to become a market analyst. You need a guide who watches the numbers every month and can tell you what they mean in plain English. That’s us. The Fairey Team, with eXp Realty, helps buyers and sellers across Evans, Martinez, Grovetown, Harlem and Appling.
The Two Numbers That Matter
Every month we report two days-on-market numbers side by side. One tracks the homes that sold. The other tracks the homes still waiting. The gap between them tells you more than any headline price.
Homes that sold in October spent an average of 82 days on the market. The median was 44 days, so half went under contract in about six weeks.
Homes still for sale on November 2 had been listed an average of 120 days so far. The median was 88 days.
That’s a 38-day gap in averages. The typical home still for sale has already been listed twice as long as the typical October sale took. When unsold homes outlast normal sales by that much, the reason is almost always price, not demand.
October 2026 at a Glance
- Homes sold: 181 (Oct 2025: 200)
- Median sold price: $334,000 (up 6.1% from $314,700)
- Average sold price: $363,579 (down 1.7% from $369,946)
- Days on market, homes sold (avg / median): 82 / 44
- Days on market, homes still for sale on Nov. 2 (avg / median): 120 / 88
- Active listings in October (MLS Market Summary): 840 (up 4.3% from 805). 787 homes were for sale on Nov. 2.
- Sold price vs. final list price (median): 100%
- Sold price vs. original list price (average): 96.5%
- New contracts written in October: 166 (down 24% from 219)
- Months of inventory: 3.85
Days on market is the MLS cumulative figure (CDOM). Active listings use the MLS Market Summary count for the month, the same basis as every year in the table below. New contracts are listings that went under contract during October, not a month-end snapshot.
How This October Compares to the Last Three
Oct 2023 | Oct 2024 | Oct 2025 | Oct 2026 | |
|---|---|---|---|---|
Active listings (MLS Market Summary) | 565 | 570 | 805 | 840 |
Homes sold | 245 | 213 | 200 | 181 |
New contracts written | 190 | 181 | 219 | 166 |
Median sold price | $334,900 | $350,000 | $314,700 | $334,000 |
Average sold price | — | $391,166 | $369,946 | $363,579 |
Average days on market (sold) | 53 | 56 | 71 | 82 |
Median days on market (sold) | — | 23 | 39 | 44 |
Months of inventory | 2.39 | 2.50 | 3.63 | 3.85 |
Oct 2023 figures come from a separate MLS Market Summary pull; average price and median days weren’t captured for that month.
Inventory is up 49% from October 2023 and 47% from October 2024. Closings have fallen every October since 2023, from 245 to 181, and homes are taking longer to sell, 82 days on average versus 53. Buyers have more choices than in any October in our series, and they’re taking their time. Sales are down, and new contracts written in October fell 24% from last year, which points to a quieter November for closings.
Prices, though, are holding. The median sale price rose 6.1% from last October. The average dipped 1.7% because fewer high-end homes happened to close this month.
By City
City | Sold | Median days to sell | Still for sale (Nov. 2) | Avg days listed so far |
|---|---|---|---|---|
Grovetown | 71 | 64 | 311 | 133 |
Evans | 61 | 36 | 262 | 106 |
Martinez | 42 | 37 | 128 | 96 |
Harlem | 6 | 34 | 45 | 94 |
Appling | 6 | 91 | 30 | 115 |
City figures use agent days on market (ADOM) from MLS search statistics, which counts 186 October closings. Harlem and Appling had six sales each, so read those rows as directional.
Evans and Martinez moved fastest in October. Grovetown has by far the most homes for sale, and its unsold listings have waited the longest, so pricing and presentation there need to be sharper than anywhere else in the county. Compare areas on our neighborhoods page.
Neighborhood Notes
- Highland Lakes has 27 homes for sale against three October sales, and the typical listing there has been on the market 191 days. Buyers have plenty of choice.
- Whispering Pines homes that were priced right sold in a median of about four weeks.
- Riverwood Plantation recorded eight sales, the most of any neighborhood we track.
Our full monthly report also tracks Bartram Trail, Knob Hill, Windmill Plantation, River Island, West Lake and Jones Creek. Ask us for the numbers on your neighborhood.
What This Means If You’re Selling
- The first price is the most important one. October’s sellers got 98.7% of their final asking price on average but only 96.5% of their original one. Chasing the market down costs more than starting in the right place.
- Sixty days without an offer is an answer. If your home has been listed for two months with no offers, buyers have already told you what they think of the price.
- Your neighborhood is its own market. County averages are a starting point. What matters is what sold near you, recently, and how long your competition has been sitting.
Find out where your home fits with a free home valuation, then read What to Fix, Update or Stage Before Selling so your listing stands out.
What This Means If You’re Buying
You have choices. 840 active listings in October.
You have time. Homes that sold in October averaged 82 days on market.
You have room to negotiate. Listings that have sat for months are often open to repair requests or help with closing costs.
Not sure where to start? See how far your savings will go in Down Payment and Closing Costs in Evans and Columbia County, or weigh the two sides of the river in Columbia County vs. Richmond County. Moving here on orders? Start with our Fort Gordon PCS guide and military relocation page.
Your Plan
- Talk with us. Tell us your goals and timeline.
- Get your numbers. We’ll pull the sales and active competition for your street, with no obligation.
- Move with confidence. We guide you from the first pricing conversation to closing day.
Waiting for the “perfect” market costs you choices, leverage or both. A clear plan gets you moved, on your terms.
Ready? Call or text the Fairey Team at (706) 480-5203, or request your free home valuation.
Want last month’s numbers? See the Columbia County housing market for September 2026, plus What a Balanced Housing Market Means in Evans and Why Days on Market Vary in Columbia County.
Frequently Asked Questions
Is the Columbia County, GA housing market crashing?
No. Sales are down, but prices are holding. The median sold price in October 2026 was $334,000, up 6.1% from $314,700 in October 2025, and sellers received a median 100% of their final asking price.
Is it a buyer's or seller's market in Columbia County, GA right now?
It's leaning toward buyers. Months of inventory reached 3.85 in October 2026, up from 3.63 in 2025, 2.50 in 2024 and 2.39 in 2023, and homes took 82 days on average to sell, up from 53 in October 2023. Well-priced homes still sell in about six weeks.
How long does it take to sell a house in Columbia County, GA?
Homes that sold in October 2026 averaged 82 days on market, with a median of 44 days. Homes still for sale on November 2 had been listed an average of 120 days (median 88).
What is the average home price in Columbia County, GA?
The average sold price in October 2026 was $363,579, and the median was $334,000.
Will home prices drop in Columbia County, GA?
No one can promise. Right now the median price is up from last year while inventory grows, so pricing your home right on day one matters more than ever.
How many homes are for sale in Columbia County, GA?
Columbia County had 840 active residential listings in October 2026 (MLS Market Summary), up 4.3% from 805 a year earlier. 787 homes were for sale on Nov. 2.
Which Columbia County towns are selling fastest?
In October 2026, Evans (median 36 days) and Martinez (37 days) sold fastest. Grovetown had the most homes for sale (311), and they had been listed the longest, 133 days on average.
How many homes went under contract in Columbia County in October 2026?
166 listings went under contract during October 2026, down 24% from 219 in October 2025. That counts homes that went pending during the month, not a month-end snapshot.
Source: Flexmls / Hive MLS, residential only (single-family, condo, townhome), Columbia County, GA, pulled November 2, 2026. County and year-over-year figures from the MLS Market Summary; city, neighborhood and active-listing figures from MLS search statistics. Data deemed reliable but not guaranteed. Past market performance is not a guarantee of future results.
Caleb Fairey | Fairey Team | eXp Realty | Evans, GA