September 2026 · Columbia County, Georgia · The Fairey Team
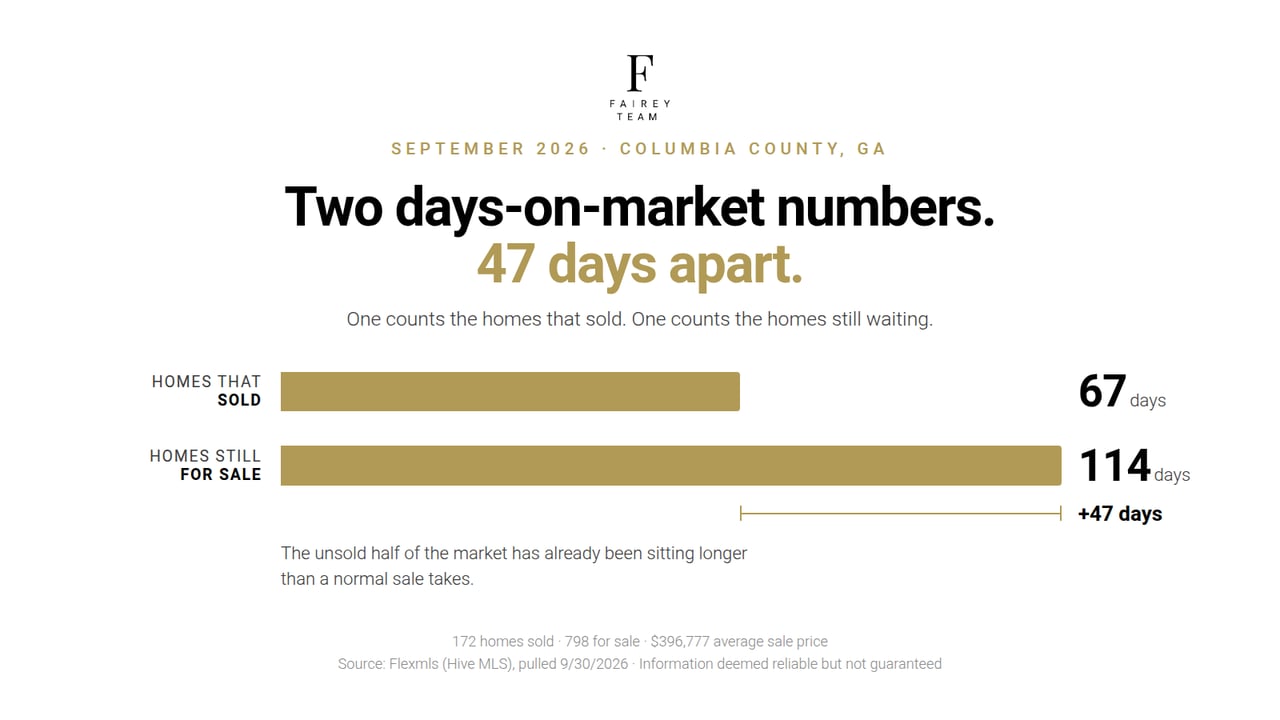
Ask most people how long it takes to sell a house in Columbia County and they'll quote you one number. Ask the MLS and you get two: homes that sold in Columbia County, GA in September 2026 took 67 days on average, while homes still for sale have been listed 114 days — almost seven weeks apart.
That disagreement is not an error. It's the most useful thing in the whole report, and once you know how to read it you'll never look at a market update the same way again.
Two Numbers, Not One
Every month we publish "average days on market." The trouble is that the phrase describes two completely different groups of houses, and nobody ever says which one they mean.
Days on market for homes that sold. Take every house that closed in September, look at how long each one sat before it went under contract, average them. This is a finished number. The clock stopped. In September 2026 that number was 67 days.
Days on market for homes still listed. Take every house sitting on the market right now and ask how long it has been there so far. This clock is still running, and it can only go up. Today that number is 114 days.
Same county, same month, same MLS. A 47-day spread.
Here's why: the first number only counts houses that succeeded. Every home in that average found a buyer. The second number counts everything that hasn't, and a house that has been listed since June is still in there adding to the total tomorrow, and the day after, until it either sells or gives up.
When the unsold group is older than the sold group, the market is telling you that a meaningful share of its inventory has already been passed over. Not waiting its turn. Passed over.
September 2026, in Full
Sold in September | Still for sale | |
|---|---|---|
Homes | 172 closed | 798 active |
Average price | $396,777 | $436,981 |
Median price | $349,950 | $375,000 |
Average days on market | 67 | 114 |
Median days on market | 39 | 83 |
Sold-to-list ratio | 97.9% average, 100% median | — |
Residential property countywide: single-family, condo and townhome.
The Average and the Median Are Telling Different Stories. Listen to Both.
Sold homes averaged 67 days. The median sold home took 39.
The median is the middle house — half sold faster, half slower. When the average sits 28 days above the median, it means a handful of listings took so long that they dragged the whole average up.
Think of ten houses. Eight sell in about five weeks. Two take seven months. The median still says five weeks, because the middle of the pack hasn't changed. But the average jumps, because those two stragglers carry enormous weight in the arithmetic.
This is the single most important thing to understand about our market right now. There is no "typical" Columbia County home taking 67 days to sell. There's a large group selling in about five or six weeks and a stubborn tail sitting for months, and the gap between them is almost entirely about price.
The sold-to-list ratio backs this up. The median sale closed at exactly 100% of the final asking price. Half the sellers in the county got every dollar they asked. The average came in at 97.9%, which means the discounting is concentrated in a minority of listings — the same ones stretching out that days-on-market average.
A Second Number Worth Learning: Months of Supply
Take the number of homes for sale and divide it by how many sold that month. The answer is roughly how long it would take to sell everything currently listed if no new listings appeared and buying continued at the same pace.
Homes for sale | Sold that month | Months of supply | |
|---|---|---|---|
September 2024 | 605 | 172 | 3.5 |
September 2025 | 783 | 219 | 3.6 |
September 2026 | 798 | 172 | 4.6 |
Historically, four to six months is considered balanced. Below that favors sellers; above it favors buyers. Columbia County has moved from 3.5 to 4.6 months in two years and crossed into balanced territory this year.
Notice how it got there. Inventory barely moved between 2025 and 2026 — up only 15 homes. What changed is that 47 fewer homes sold. Supply didn't flood in this year. Demand stepped back.
Three Septembers, Side by Side
Sept 2024 | Sept 2025 | Sept 2026 | |
|---|---|---|---|
Homes for sale | 605 | 783 | 798 |
Homes sold | 172 | 219 | 172 |
Average sale price | $362,503 | $371,657 | $396,777 |
Median sale price | $335,900 | $332,000 | $349,950 |
Average days to sell | 64 | 64 | 67 |
Three things stand out.
Inventory is up 32% in two years. From 605 homes to 798.
Sales are flat over two years and down sharply from last year. 172 homes closed this September, identical to September 2024, and 21% below last September's 219.
Prices went up anyway. The average sale price is up 6.8% from last year and 9.5% from two years ago. The median is up 4.2% over two years.
That last one surprises people, and it's worth sitting with. Basic supply and demand says a third more inventory plus fewer buyers should push prices down. It hasn't. Not in any of these three Septembers.
What changed instead was time. Sellers in Columbia County are still getting their price. They're waiting longer to get it, and more of them are giving up before they do. In a market where sellers can afford to wait — low existing mortgage rates, no forced-sale pressure — that's often how an adjustment shows up first. Time moves before price does.
Where You Live Changes the Answer: Grovetown, Evans, Martinez, Harlem and Appling
City | Sold | Avg sale price | Days to sell | For sale | Avg asking | Days listed |
|---|---|---|---|---|---|---|
Grovetown | 60 | $337,835 | 62 | 322 | $356,760 | 122 |
Evans | 56 | $527,326 | 75 | 252 | $563,634 | 103 |
Martinez | 33 | $307,669 | 58 | 136 | $351,838 | 85 |
Harlem | 18 | $320,029 | 66 | 49 | $401,167 | 78 |
Appling | 5 | $506,355 | 41 | 34 | $676,384 | 110 |
Columbia County | 172 | $396,777 | 67 | 798 | $436,981 | 114 |
Compare the last two columns in each row. That ratio is the local version of the same story.
Grovetown has the widest split in the county
Homes that sold went in 62 days, second-fastest anywhere. Homes still listed have been sitting 122 days — twice as long. Grovetown also holds 322 active listings, 40% of everything for sale in the county. If you're selling there, you are in the most crowded field in Columbia County, and the difference between pricing right and pricing hopefully is the difference between two months and something much longer.
Martinez is the county's tightest market
58 days to sell, 85 days on current inventory. The smallest gap of any city, and the most affordable at $307,669 average. Less room between what's moving and what's stuck.
Evans carries the money and takes its time
The highest sale prices in the county at $527,326 and 75 days to sell. Higher price bands almost always move slower — there are simply fewer buyers at every step up — so this is normal, not a warning sign.
Appling is the small-sample caution
Five sales, averaging 41 days, which reads as the fastest market in the county. With five transactions, one unusual house swings that number wildly. Its 34 active listings sitting 110 days are the more reliable signal.
Inside the Neighborhoods We Track
Subdivision | For sale | Avg asking | Days listed | Sold in Sept |
|---|---|---|---|---|
30 | $584,957 | 153 | 4 | |
13 | $725,246 | 117 | 6 | |
10 | $642,770 | 53 | 0 | |
10 | $505,420 | 135 | 3 | |
Windmill Plantation | 8 | $473,487 | 95 | 1 |
7 | $1,206,200 | 92 | 5 | |
7 | $799,257 | 125 | 2 | |
Bartram Trail (incl. Sunbury) | 7 | $635,886 | 87* | 1 |
Knob Hill | 4 | $498,675 | 186 | 0 |
*Bartram Trail's average days listed excludes one outlier listing.
Highland Lakes is carrying the load. Thirty listings, nearly a third of all inventory across these nine neighborhoods, averaging 153 days on the market. Four sold in September. That's a lot of competition for a slow trickle of buyers.
River Island is the healthiest of the group. Seven listings averaging 92 days, and five sales in a single month — more closings than any tracked neighborhood except Riverwood. At a $1.2 million average asking price, that's genuine strength at the top of the county.
Jones Creek's 53 days is the newest inventory of the nine, and it had no September closings. Those two facts go together: its listings simply haven't been on the market long enough yet. This is a number to watch next month, not to read as weakness now.
Knob Hill's 186 days across four listings is the longest in the report. Four homes is a small sample, but 186 days is not ambiguous. Those listings are stuck.
And a good lesson in small numbers: Windmill Plantation's single September sale took 249 days, while its eight active listings average 95. One transaction is not a trend. If we printed only that 249, you'd conclude the neighborhood was frozen. The eight active listings say otherwise.
That's why every number in this report carries its sample size, and why we grey out any average built on fewer than four sales.
What to Do With All This
If you're selling. The county is handing you a clear choice. Price to the first two weeks and the data says roughly 39 days to a contract at essentially full asking price. Price to what you hope it's worth and you join a pool of listings averaging 114 days. There isn't much middle ground — the distribution is genuinely split, and where your house lands is decided in the first fortnight.
Get your own neighborhood's numbers, not the county's. Grovetown and Martinez are running different markets.
If you're buying. You have 798 homes to choose from, 32% more than two years ago, and fewer competitors than last year. You won't find much give on a freshly listed, well-priced house — the median seller is getting full ask. Your leverage is in that long tail. A listing past 120 days has a seller who has already watched several rounds of buyers walk by, and that seller is in a very different frame of mind than one who listed last week.
If you're just keeping an eye on things. Prices firm, sales volume soft, inventory steady, time to sell stretching. That's a market rebalancing through patience rather than price.
How to Read Any Market Report From Here On
- Ask which days-on-market number you're looking at. Sold or active? They're different populations and they answer different questions.
- Always ask for the median next to the average. When they diverge, the tail is doing the talking.
- Check the sample size. A neighborhood average built on one sale is a headline, not a fact.
- Look at months of supply, not just listing counts. 798 homes means nothing without knowing how fast they're selling.
- Go one level down. County numbers are a starting point. Your subdivision is the answer.
Columbia County Housing Market FAQ
What is the average home price in Columbia County, GA?
Homes that sold in Columbia County in September 2026 averaged $396,777, with a median sale price of $349,950. Homes currently for sale are asking an average of $436,981.
How long does it take to sell a house in Columbia County, GA?
Homes that sold in September 2026 took 67 days on average, but the median was 39 days — half sold faster than that. Homes still for sale have been listed an average of 114 days.
What does days on market mean in real estate?
Days on market is how long a home has been listed. For sold homes, it counts the days until the home went under contract. For homes still for sale, it counts the days listed so far, and it keeps rising until the home sells or comes off the market.
Is Columbia County a buyer's or seller's market right now?
Balanced. Columbia County had 4.6 months of supply in September 2026, and four to six months is considered balanced. Prices are still rising, but homes are taking longer to sell.
Looking for last month's numbers? Read the August 2026 Columbia County Report.
The Columbia County Report is published monthly by the Fairey Team. Data source: Flexmls (Hive MLS), pulled September 30, 2026, covering residential property — single-family, condo and townhome — in Columbia County, Georgia. Days on market is the MLS cumulative figure. Averages built on fewer than four sales are directional and labeled. Information deemed reliable but not guaranteed. Past performance is not a guarantee of future results.
Want the number for your own street instead of the county's? That's a five-minute conversation. Reach out: (706) 480-5203.